
Global health’s long-term dollar problem
Why the beyond-aid transition relies on exports and not just taxes

What has been the financial impact of cuts to global health funding over the past 18 months? That feels like an important question if you are a minister of health or working in an international health organisation, but it is hard to answer. Various pieces of work have tried to disentangle the impacts arising specifically from the US-funded aid programmes at the start of 2025. This, however, tells us little about whether other actors have responded to try to fill those gaps.
One key challenge in answering this question relates to the way that health systems are funded. There is a patchwork of different organisations with different funding mechanisms and supply chains. Financial reports are generated by separate donor reporting systems, often with a lag. National budget reports also have limitations: typically, spending is reported by department and facility rather than by health condition (because departments and facilities choose how to control money rather than health conditions). This makes it hard to tease out of budgetary reports whether governments are closing any gaps in funding arising from cuts to vertically funded programmes focused on particular interventions.
Trade data is a less obvious place to look at the impact of aid cuts, but it can reveal useful insights. Most aid-dependent countries rely on imports for the key commodities at the heart of vertically-funded programmes such as PEPFAR for HIV, the Global Fund for HIV, tuberculosis and malaria, the President’s Malaria Initiative, Gavi for immunisation, and UNFPA for family planning. Tracking imports of vaccines, antiretrovirals, antimalarials and contraceptives therefore provides a useful input into understanding what is happening to procurement under these programmes.
One helpful feature of trade data is that it is reported by both exporters and importers. Most major pharmaceutical exporters update their information frequently. For example, India, the largest exporter of pharmaceutical commodities to Africa, has reported its export data up to October 2025. Even if the importing country has not yet updated its trade data, you still have a useful steer on what is happening.
Trade data also has its limits: it records the arrival of goods at the border, not where they go from there or who paid for them. The data is also lumpy at country and commodity level, with procurement arriving in large discrete shipments that can swing single-year numbers significantly. It also tells us nothing about whether staff are being paid to actually hand out medicines. With those qualifications in mind, what does the trade data show?
Have aid cuts disrupted pharmaceutical flows?
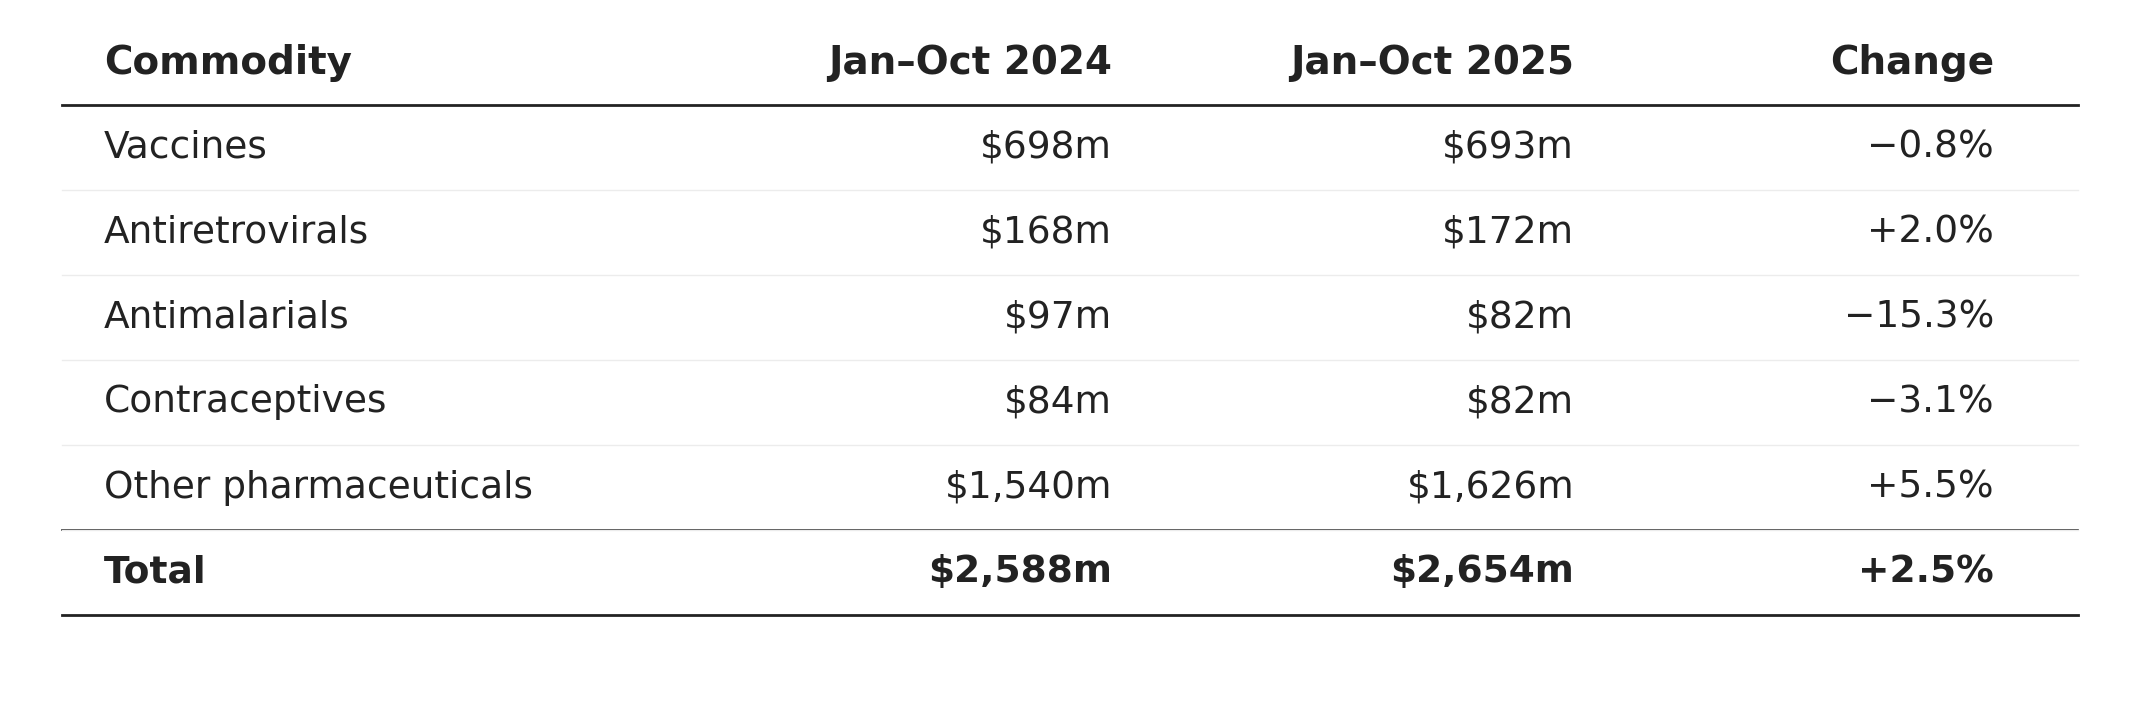
For an eleven-country panel[1], Comtrade data from January to October 2025 suggests that in aggregate pharmaceutical imports have not collapsed over the period. Total imports were 2.5% higher than in the same period of 2024. Beneath the aggregate, vertically funded commodity lines, including vaccines, antiretrovirals and contraceptives, were also broadly stable. There is one substantive exception: antimalarial imports are 15% less in value terms relative to the previous year.
Comparing value of commodity imports (US$m), January to October, 2024 vs 2025
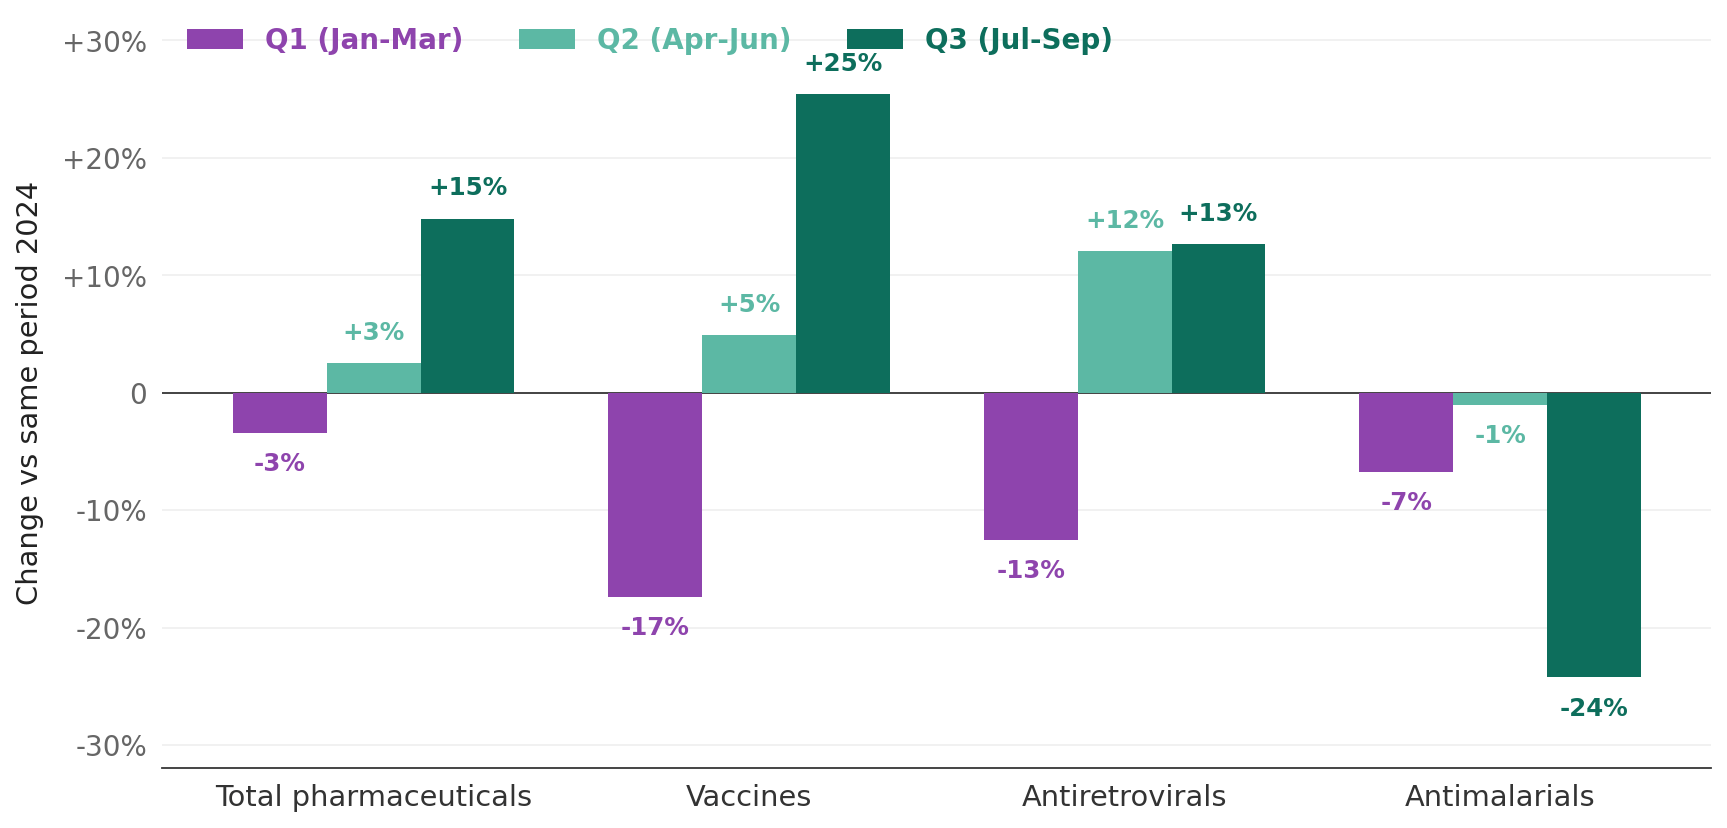
Looking at the quarterly breakdown of imports, you see a sharp fall in the values of vaccines and ARVs imported in the first quarter of the year consistent with the USAID closure and associated disruption. The flow of these commodities then seems to recover in the second and third quarters. Antimalarials are the exception to this recovery pattern and the trajectory is harder to read. Imports were modestly below their 2024 level in the first quarter, broadly flat through the second, and substantially lower in the three months from July to September. This is the only commodity class in the picture where the disruption pattern deepened rather than reversed across the year.
Within-year pattern of pharmaceutical imports, 2025 vs 2024
These year-on-year changes need to be set against the scale of what is being measured. In per capita terms, the total value of pharmaceutical imports in 2024 came to just under six dollars per person per year, which is about a cent and a half per person per day. The African Union Development Agency estimates that 70%-80% of medicines consumed across Africa are imported, with local production filling the remainder. For the panel of countries here, the share is likely higher as the panel largely excludes major African producers like South Africa and Egypt (although Nigeria is captured in the panel and has a growing pharmaceutical manufacturing sector). The $6 per-capita import figure understates annual average per-capita consumption of pharmaceutical commodities, but probably not by much.
What has changed over the past decade?
The disruptions to commodity flows in early 2025 follow a decade where the overall value of pharmaceutical imports has barely shifted. There has been an increase of about 5% over the past ten years, which translates to a per-capita decline of roughly 17%. Yet underneath this aggregate picture, you see a striking divergence across different groups of commodities.
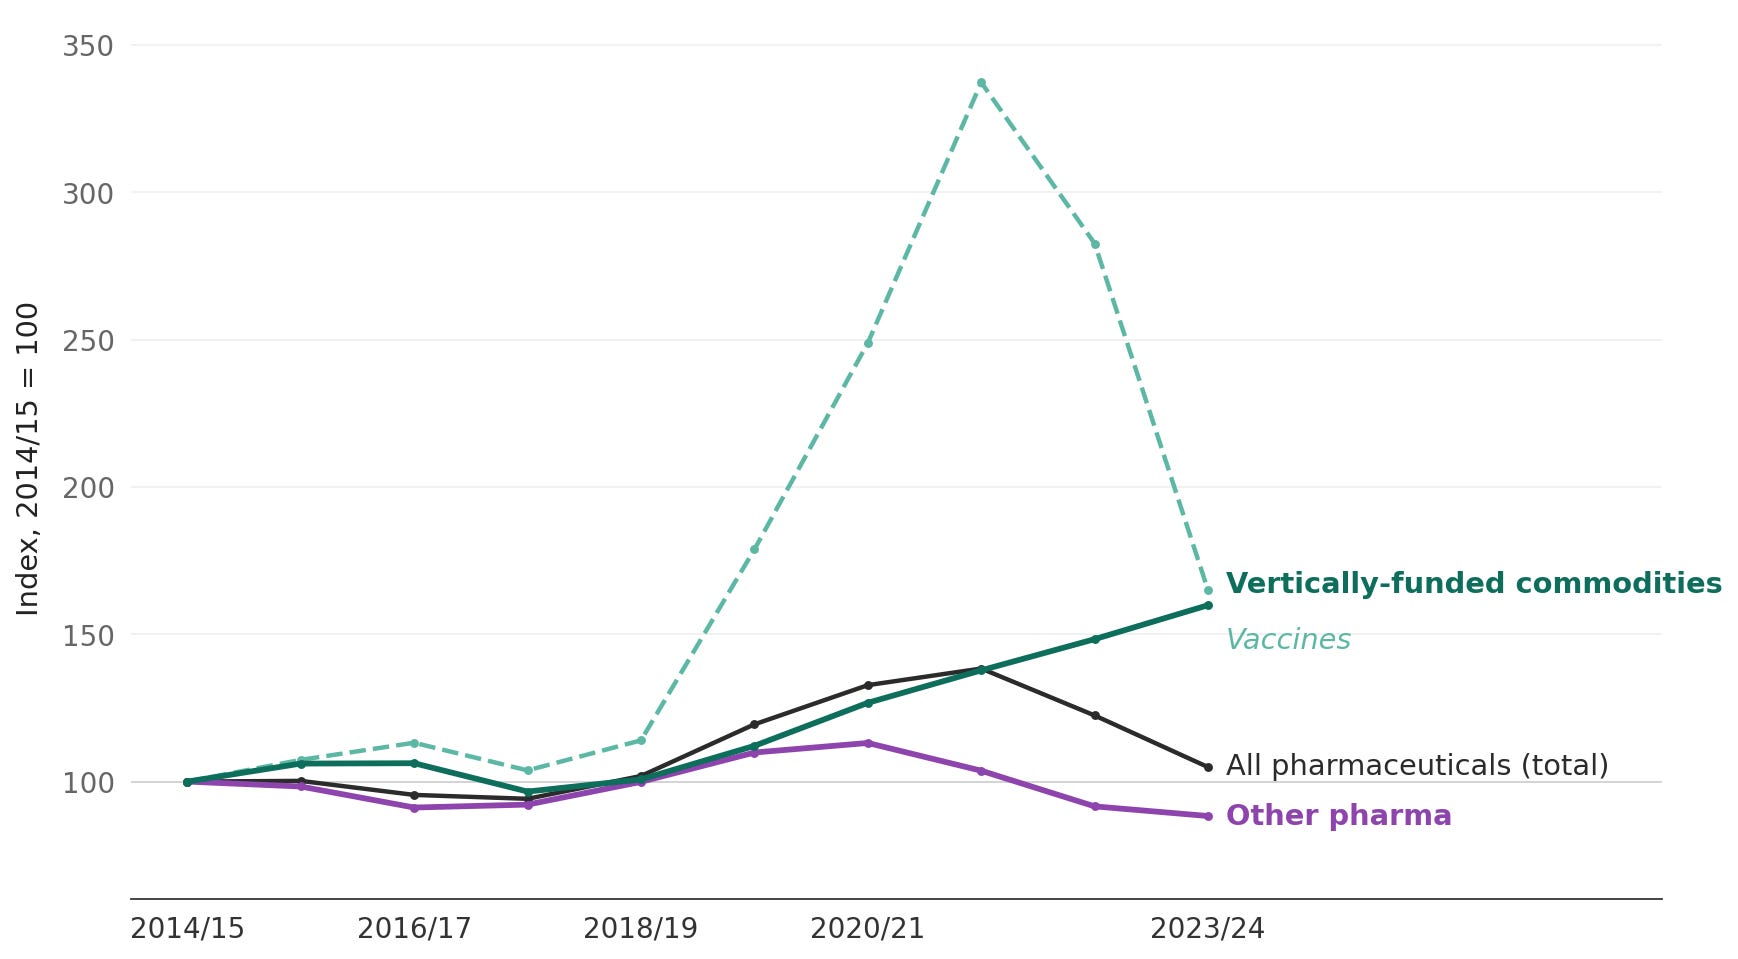
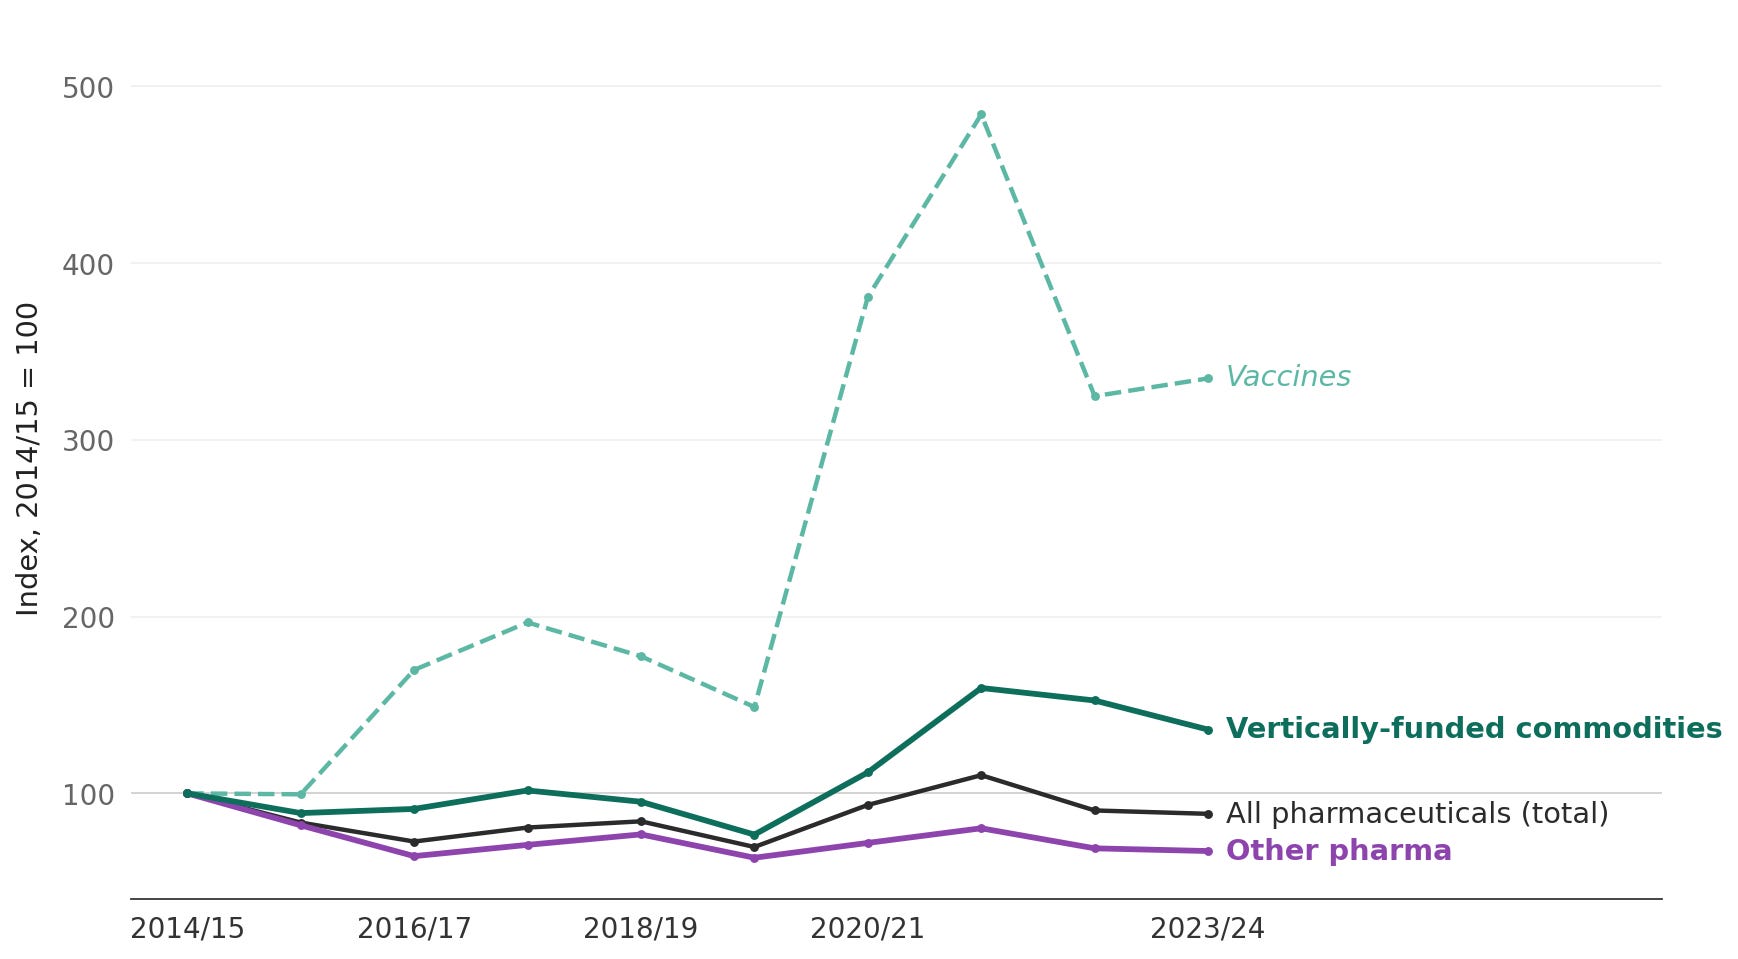
In the chart below, the two green lines highlight vertically funded commodity lines. Vaccines surged during the COVID procurement period of 2020-2022 and partially unwound, but their 2024 level is still 65% above 2014. The group of other vertically funded commodities (combining antiretrovirals, antimalarials, and contraceptives) grew by roughly 60% across the decade and were still rising into 2024.
In contrast, you see a purple line of ‘other pharma’ that has declined by roughly 10-12% over the same period. For the purposes of this chart, ‘other pharma’ is a residual category covering everything in the pharmaceutical chapter of the trade statistics that does not fall into the named donor-funded commodity lines above. It is dominated by other finished medicines, including for example antibiotics, cardiovascular drugs, diabetes medications, painkillers, and basic over-the-counter medicines[3]. This ‘other pharma’ category is paid for predominantly through a mix of public health budgets and out-of-pocket spending. At the panel level, ‘other pharma’ constitutes about 60% of the total import basket.
Pharmaceutical imports in to 11 African countries, 2014 - 2024
What is driving this divergence?
Zooming in to trends in specific countries can give some clues as to what might be driving these diverging patterns. Take, for example, Nigeria, which is the panel’s largest market for pharmaceutical imports. The vertically-funded commodity lines rose roughly 70% between 2014 and 2024. In contrast, imports of ‘other pharma’ were about 20% less in 2024 than ten years previously.
Pharmaceutical imports in to Nigeria, 2014 - 2024
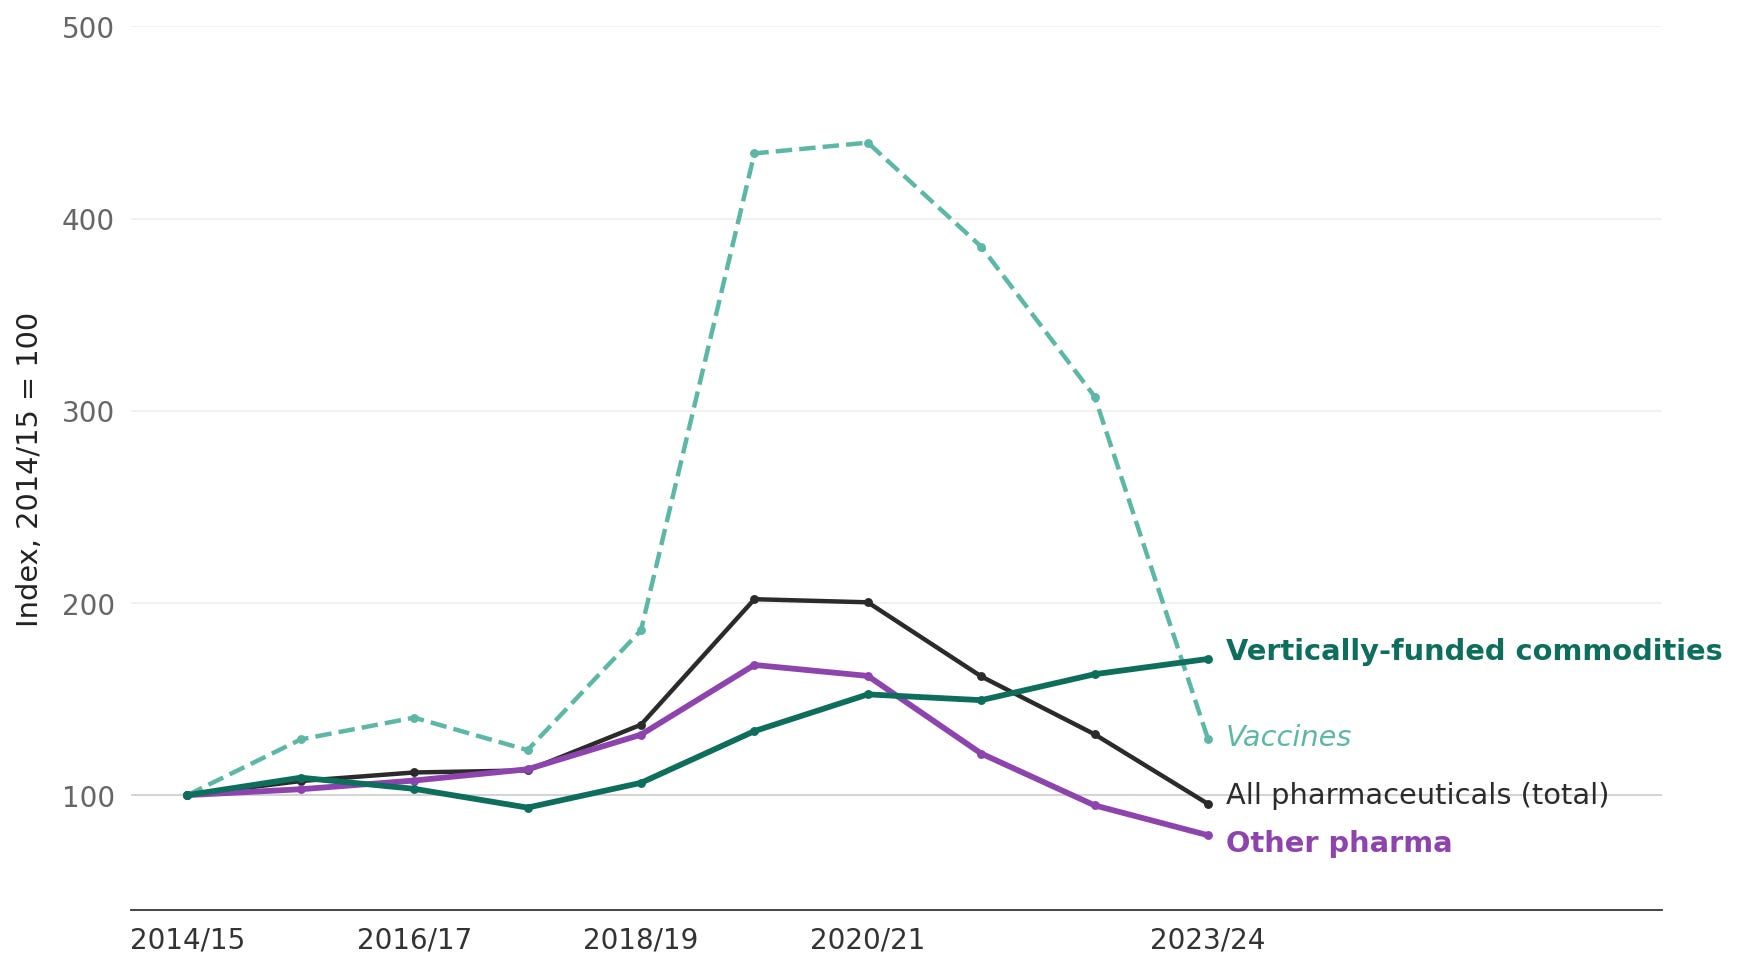
The observed decline in the value of ‘other pharma’ might not mean that there have been fewer medicines available. The prices of generic medicines have fallen substantially over the decade. Some of the apparent decline may also reflect domestic production filling part of what was previously imported. Nigeria also has the largest domestic pharmaceutical sector in the panel, with around 115 licensed firms manufacturing basic generic medicines for the local market.
However, this downward trend has not been a gradual decline. The divergence with the vertically-funded commodities begins to widen around 2021, when Nigeria was beginning to face acute shortages of foreign exchange in the economy. Official and parallel exchange rates became increasingly detached before a sharp devaluation took place in 2023. Imports of dollar-priced pharmaceuticals compressed as domestic buyers (the public health system, private importers, pharmacies etc.) adjusted to tighter foreign exchange markets. In contrast, imports of donor-procured commodities, which sit outside the domestic foreign exchange system, continued to grow.
Some confirmation of this reading is visible in the more recent data, which the chart above does not yet capture. Through the first ten months of 2025, as foreign exchange conditions stabilised, Nigerian commercial pharmaceutical imports rebounded sharply. The ‘other pharma’ category was up roughly 24% on the same period of 2024, and 16% above 2023 levels. A rebound on this scale is more consistent with demand having been suppressed by foreign exchange scarcity than more demand now being permanently met by domestic production.
A similar dynamic of import compression is visible in Ghana, although the specific timings differ. A decade ago, the cedi depreciated sharply during the course of 2014 before the country entered an IMF Extended Credit Facility in April 2015. Ghana’s ‘other pharma’ imports fell by roughly a third in dollar terms over two years, while imports of vertically-funded commodity lines held essentially flat through the same period. A similar but smaller compression is visible after Ghana’s recent default. The country’s ‘other pharma’ imports drifted lower from 2022 through 2024, while vertically-funded lines remained well above their 2014 baseline.
Pharmaceutical imports in to Ghana, 2014-2024
What does this mean for the beyond-aid transition?
The fact that the imports of donor-backed commodities have diverged from wider pharmaceutical imports may not come as a particular surprise to global health specialists. It is widely appreciated that donor funding is subject to different kinds of external pressures. However, the picture in Ghana and Nigeria described above does point to structural risks to health financing beyond aid that are often glossed over.
Typically, the beyond-aid transition in the health sector is framed as a fiscal challenge. The core argument essentially runs that governments need to step up and collect more taxes and prioritise certain health services to fill the gaps left by dwindling aid budgets. This is certainly an important element of the overall puzzle. Without sufficient tax collection, governments cannot fund the public health functions that no individual will pay for privately, or pool resources at the scale needed to protect the most vulnerable from health costs they cannot meet themselves.
What such discussions miss, however, is that imported health commodities depend on foreign exchange. Contrary to common discourse, aid and tax are not in this regard perfectly substitutable forms of finance. An aid dollar buys an imported ARV; a cedi or naira raised through taxation buys whatever can be procured in local currency at the prevailing exchange rate.
The availability of foreign exchange is not directly linked to the government’s tax collection capacity. It comes from the wider economy: from exports, from remittances sent home by workers abroad, from foreign investment, and historically also from aid flows themselves. Of these, only exports and remittances are reliably present in an imagined ‘beyond aid’ future. Aid is precisely what is contracting; external borrowing is intermittent and conditional, and ultimately has to be repaid. The availability of foreign exchange that is reliable enough to plan health procurement around depends on the breadth and depth of the wider economy's productive capacity: on having a range of goods to sell, or labour to provide, that the rest of the world wants to pay for.
This then is global health’s long-term dollar problem in a world beyond aid. Earmarked aid flows have enabled lower-income countries to import cutting-edge technologies embodied in pharmaceutical products developed and manufactured elsewhere. This model has done much to drive remarkable gains in health outcomes over the past two decades. The structural question is not whether that model was effective; it clearly was. The question is what happens to commodity flows if that financing dries up.
The post-aid transition implies replacing donor financing with domestic tax revenues. Those revenues have to be exchanged for hard currency before any imported commodity can be procured. At that point, vaccines and antimalarials move from one financing regime to another. They lose the insulation that donor procurement provided, and the trajectory visible in the “other pharma” line in both Nigeria and Ghana becomes relevant for the entire import basket. A health ministry trying to buy antimalarials is now competing for foreign exchange with firms importing machinery, households buying imported food or fuel, and other parts of government meeting their own dollar-denominated obligations.
A common response might be that domestic budget allocations would need to shift accordingly. Technical assistance might focus on better cost-effectiveness analysis or tracking resource flows for treatment of certain conditions. Investments could be channelled to advocates to make the case for increased health spending. The implicit theory in these tools is that the binding constraint on outcomes is the quality of allocation decisions, and that better information, better processes, and better political preferences will translate scarce resources into more health gains.
The constraint identified by the trade data above sits upstream of all three. It is not really a constraint on the quality of allocation processes: it is a constraint on what the procurement portion of the budget can actually buy given the relative cost of foreign exchange. A government can have the same doctors and nurses on payroll and the same political commitment to health spending, and still find that the budget for health commodities buys twenty per cent less medicine than it did the year before, because of exchange rate movements.
This is not an argument that the global health community should retool itself toward trade and industrial policy. The comparative advantage of the field sits with disease control, clinical evidence, procurement, and health systems strengthening, and there are good reasons for that to remain the case. But it does point to certain limits of what budget advocacy alone can deliver, in countries operating under sustained foreign exchange pressure. People who care about how health services will be financed ‘beyond aid’ should be as concerned about exports and remittances as they are about taxes and budgets.
[1] The panel comprises eleven sub-Saharan African economies: Kenya, Tanzania, Uganda, Ethiopia, Mozambique, Malawi, Zambia, Rwanda, Nigeria, Ghana, and the Democratic Republic of the Congo. Together they account for around 760 million people (roughly half of Africa’s population) and include most of the region’s largest recipients of donor-financed health programmes. Francophone West African economies are excluded primarily because France, a major source country for their pharmaceutical imports, files Comtrade returns with substantial delays, making the recent-period comparison less reliable for them.
[2] Comtrade data fills in over time, so comparing complete past years to partial current ones produces apparent declines that are reporting artefacts. The “reliable reporter” subset used here restricts both years to exporters that filed substantively and on time in both. It captures around 78% of total panel pharmaceutical exports for 2024. India accounts for roughly half; the principal excluded reporters are China (12%), France (4%), Korea (2%) and Indonesia (2%).
[3] It also includes wound dressings and bandages, diagnostic reagents, and a handful of smaller medical preparations, but finished-medicines constitute around three quarters of the total.
[4] The long-run charts use the OECD’s Balanced International Merchandise Trade Statistics (BIMTS) rather than Comtrade. BIMTS reconciles exporter and importer reports for each bilateral trade flow and applies a consistent methodology for imputing missing values, which produces a cleaner long-run series than raw Comtrade does. The trade-off is that BIMTS publishes with a longer lag (currently through 2024), so it cannot be used for the most recent period.